|
|
2011 Massachusetts State Report Card
Part III - State Achievement in English Language Arts, Mathematics & Science and Technology/Engineering2011 MCAS Results by Student Group by Grade and SubjectStudent Status, Low Income, Migrant information was as reported by the principals or designees.
Race & Gender are as reported by the students.
More about the data
Data Last Updated on September 30, 2011
| GRADE LEVEL 3 - READING |
|---|
| Student Group |
State |
| Students Included |
AYP Part. |
% at Each Level |
CPI |
SGP |
Incl. in SGP (#) |
| # |
% |
A |
P |
NI |
W |
| AYP Subgroups |
| Stud. w/ Disab | 12,739 | 99 | 2 |
22 |
45 |
32 |
64.9 | N/A |
N/A |
| EL/Former EL | 8,640 | 99 | 3 |
30 |
46 |
22 |
67.1 | N/A |
N/A |
| Low-Income | 25,489 | 100 | 4 |
36 |
44 |
16 |
73.0 | N/A |
N/A |
| African American/Black | 5,473 | 99 | 3 |
34 |
45 |
18 |
71.4 | N/A |
N/A |
| Asian | 4,123 | 99 | 17 |
52 |
24 |
7 |
87.4 | N/A |
N/A |
| Hispanic/Latino | 11,279 | 99 | 3 |
33 |
45 |
19 |
70.6 | N/A |
N/A |
| Native American | 168 | 100 | 8 |
39 |
40 |
13 |
78.9 | N/A |
N/A |
| White | 46,895 | 100 | 13 |
56 |
26 |
6 |
88.2 | N/A |
N/A |
| |
| Other Student Groups |
| High Needs | 33,772 | 99 | 4 |
35 |
44 |
17 |
73.2 | N/A |
N/A |
| Male | 35,816 | 100 | 8 |
49 |
32 |
11 |
81.9 | N/A |
N/A |
| Female | 34,138 | 100 | 14 |
51 |
28 |
7 |
86.0 | N/A |
N/A |
| Title I | 25,849 | 100 | 4 |
37 |
44 |
15 |
73.7 | N/A |
N/A |
| Non-Title I | 44,129 | 100 | 15 |
58 |
22 |
5 |
89.8 | N/A |
N/A |
| Non-Low Income | 44,489 | 100 | 15 |
58 |
22 |
4 |
90.2 | N/A |
N/A |
| EL | 6,428 | 99 | 1 |
23 |
49 |
26 |
61.8 | N/A |
N/A |
| Former EL | 2,212 | 100 | 8 |
48 |
36 |
8 |
82.5 | N/A |
N/A |
| 1st Yr EL* | 538 | 93 | - |
- |
- |
- |
- | N/A |
N/A |
| Native Hawaiian/ Pacific Islander | 75 | 99 | 7 |
49 |
36 |
8 |
80.7 | N/A |
N/A |
| Multi-race - Non-Hispanic/Latino | 1,941 | 100 | 12 |
51 |
29 |
7 |
85.6 | N/A |
N/A |
| |
| All Students |
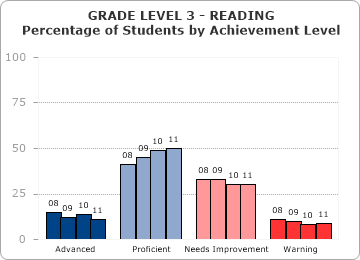
| 2011 | 69,978 | 100 | 11 |
50 |
30 |
9 |
83.9 | N/A |
N/A |
| 2010 | 70,622 | 100 | 14 |
49 |
30 |
8 |
85.8 | N/A |
N/A |
 |
| GRADE LEVEL 3 - MATHEMATICS |
|---|
| Student Group |
State |
| Students Included |
AYP Part. |
% at Each Level |
CPI |
SGP |
Incl. in SGP (#) |
| # |
% |
A |
P |
NI |
W |
| AYP Subgroups |
| Stud. w/ Disab | 12,754 | 99 | 3 |
28 |
36 |
33 |
67.1 | N/A |
N/A |
| EL/Former EL | 8,687 | 100 | 7 |
37 |
35 |
21 |
71.8 | N/A |
N/A |
| Low-Income | 25,511 | 100 | 6 |
40 |
35 |
19 |
74.3 | N/A |
N/A |
| African American/Black | 5,479 | 100 | 4 |
35 |
38 |
23 |
69.8 | N/A |
N/A |
| Asian | 4,131 | 100 | 26 |
53 |
15 |
5 |
91.7 | N/A |
N/A |
| Hispanic/Latino | 11,319 | 100 | 5 |
38 |
37 |
20 |
72.3 | N/A |
N/A |
| Native American | 165 | 99 | 9 |
45 |
33 |
13 |
80.6 | N/A |
N/A |
| White | 46,896 | 100 | 15 |
57 |
21 |
6 |
88.9 | N/A |
N/A |
| |
| Other Student Groups |
| High Needs | 33,822 | 100 | 6 |
40 |
35 |
19 |
74.9 | N/A |
N/A |
| Male | 35,836 | 100 | 14 |
51 |
24 |
11 |
84.6 | N/A |
N/A |
| Female | 34,172 | 100 | 13 |
53 |
25 |
9 |
84.9 | N/A |
N/A |
| Title I | 25,870 | 100 | 6 |
41 |
35 |
17 |
75.4 | N/A |
N/A |
| Non-Title I | 44,165 | 100 | 18 |
58 |
19 |
6 |
90.2 | N/A |
N/A |
| Non-Low Income | 44,524 | 100 | 18 |
58 |
19 |
5 |
90.7 | N/A |
N/A |
| EL | 6,474 | 100 | 4 |
33 |
38 |
25 |
67.5 | N/A |
N/A |
| Former EL | 2,213 | 100 | 13 |
50 |
28 |
9 |
84.4 | N/A |
N/A |
| 1st Yr EL* | 606 | 98 | - |
- |
- |
- |
- | N/A |
N/A |
| Native Hawaiian/ Pacific Islander | 75 | 99 | 11 |
44 |
35 |
11 |
79.0 | N/A |
N/A |
| Multi-race - Non-Hispanic/Latino | 1,943 | 100 | 15 |
50 |
26 |
9 |
84.9 | N/A |
N/A |
| |
| All Students |
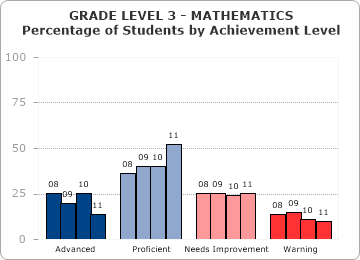
| 2011 | 70,035 | 100 | 14 |
52 |
25 |
10 |
84.7 | N/A |
N/A |
| 2010 | 70,552 | 100 | 25 |
40 |
24 |
11 |
83.8 | N/A |
N/A |
 |
| GRADE LEVEL 4 - ENGLISH LANGUAGE ARTS |
|---|
| Student Group |
State |
| Students Included |
AYP Part. |
% at Each Level |
CPI |
SGP |
Incl. in SGP (#) |
| # |
% |
A |
P |
NI |
W |
| AYP Subgroups |
| Stud. w/ Disab | 13,497 | 99 | 1 |
14 |
44 |
41 |
57.9 | 36.0 |
11,539 |
| EL/Former EL | 7,866 | 99 | 3 |
25 |
45 |
28 |
62.5 | 47.0 |
6,862 |
| Low-Income | 25,847 | 99 | 3 |
29 |
46 |
22 |
67.5 | 42.0 |
23,562 |
| African American/Black | 5,629 | 99 | 3 |
27 |
46 |
24 |
66.2 | 41.0 |
5,011 |
| Asian | 4,054 | 100 | 18 |
47 |
27 |
8 |
84.5 | 63.0 |
3,760 |
| Hispanic/Latino | 10,865 | 99 | 3 |
26 |
45 |
26 |
64.9 | 43.0 |
9,755 |
| Native American | 164 | 100 | 5 |
30 |
48 |
16 |
70.0 | 43.0 |
153 |
| White | 48,076 | 100 | 11 |
48 |
32 |
8 |
83.8 | 51.0 |
45,896 |
| |
| Other Student Groups |
| High Needs | 34,226 | 99 | 3 |
28 |
47 |
23 |
67.3 | 42.0 |
30,918 |
| Male | 36,389 | 99 | 6 |
39 |
40 |
15 |
75.6 | 43.0 |
33,905 |
| Female | 34,506 | 100 | 13 |
47 |
31 |
9 |
83.4 | 57.0 |
32,658 |
| Title I | 25,673 | 99 | 4 |
29 |
46 |
21 |
68.1 | 43.0 |
23,608 |
| Non-Title I | 45,247 | 100 | 13 |
51 |
29 |
7 |
85.8 | 54.0 |
42,965 |
| Non-Low Income | 45,073 | 100 | 14 |
51 |
29 |
6 |
86.2 | 54.0 |
43,011 |
| EL | 5,499 | 99 | 1 |
17 |
47 |
34 |
56.0 | 46.0 |
4,604 |
| Former EL | 2,367 | 99 | 7 |
42 |
40 |
12 |
77.7 | 52.0 |
2,258 |
| 1st Yr EL* | 489 | 93 | - |
- |
- |
- |
- | N/A |
N/A |
| Native Hawaiian/ Pacific Islander | 96 | 100 | 13 |
43 |
29 |
16 |
80.2 | 56.0 |
88 |
| Multi-race - Non-Hispanic/Latino | 2,011 | 100 | 10 |
43 |
36 |
11 |
79.4 | 51.0 |
1,900 |
| |
| All Students |
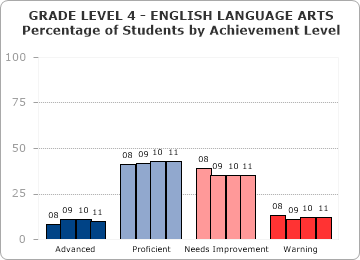
| 2011 | 70,920 | 100 | 10 |
43 |
35 |
12 |
79.4 | 51.0 |
66,573 |
| 2010 | 70,911 | 100 | 11 |
43 |
35 |
12 |
80.1 | 50.0 |
66,628 |
 |
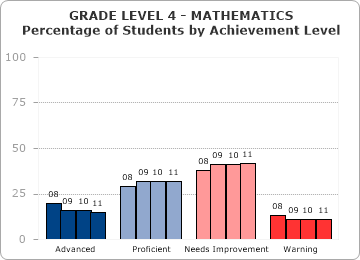
| GRADE LEVEL 4 - MATHEMATICS |
|---|
| Student Group |
State |
| Students Included |
AYP Part. |
% at Each Level |
CPI |
SGP |
Incl. in SGP (#) |
| # |
% |
A |
P |
NI |
W |
| AYP Subgroups |
| Stud. w/ Disab | 13,563 | 99 | 3 |
13 |
48 |
36 |
60.1 | 39.0 |
11,615 |
| EL/Former EL | 7,934 | 100 | 7 |
21 |
48 |
24 |
65.1 | 50.0 |
6,830 |
| Low-Income | 25,922 | 100 | 6 |
22 |
52 |
20 |
67.4 | 45.0 |
23,521 |
| African American/Black | 5,664 | 100 | 5 |
18 |
53 |
25 |
63.1 | 42.0 |
5,032 |
| Asian | 4,060 | 100 | 32 |
36 |
27 |
6 |
87.4 | 66.0 |
3,758 |
| Hispanic/Latino | 10,908 | 100 | 5 |
20 |
51 |
23 |
65.2 | 46.0 |
9,694 |
| Native American | 162 | 100 | 9 |
22 |
54 |
15 |
70.8 | 50.0 |
153 |
| White | 48,172 | 100 | 17 |
36 |
39 |
7 |
82.5 | 50.0 |
45,994 |
| |
| Other Student Groups |
| High Needs | 34,365 | 100 | 6 |
22 |
51 |
21 |
67.6 | 45.0 |
30,944 |
| Male | 36,503 | 100 | 15 |
32 |
41 |
12 |
78.5 | 50.0 |
33,985 |
| Female | 34,570 | 100 | 15 |
33 |
42 |
10 |
78.2 | 50.0 |
32,633 |
| Title I | 25,760 | 100 | 7 |
22 |
52 |
19 |
68.2 | 46.0 |
23,569 |
| Non-Title I | 45,341 | 100 | 20 |
38 |
36 |
7 |
84.2 | 52.0 |
43,060 |
| Non-Low Income | 45,179 | 100 | 20 |
38 |
36 |
6 |
84.7 | 52.0 |
43,108 |
| EL | 5,566 | 100 | 5 |
17 |
50 |
29 |
59.8 | 50.0 |
4,588 |
| Former EL | 2,368 | 100 | 13 |
32 |
44 |
11 |
77.6 | 51.5 |
2,242 |
| 1st Yr EL* | 556 | 99 | - |
- |
- |
- |
- | N/A |
N/A |
| Native Hawaiian/ Pacific Islander | 96 | 100 | 16 |
33 |
39 |
13 |
78.9 | 44.0 |
90 |
| Multi-race - Non-Hispanic/Latino | 2,011 | 100 | 16 |
30 |
43 |
11 |
77.0 | 50.0 |
1,897 |
| |
| All Students |
| 2011 | 71,101 | 100 | 15 |
32 |
42 |
11 |
78.4 | 50.0 |
66,629 |
| 2010 | 70,924 | 100 | 16 |
32 |
41 |
11 |
78.7 | 49.0 |
66,792 |
 |
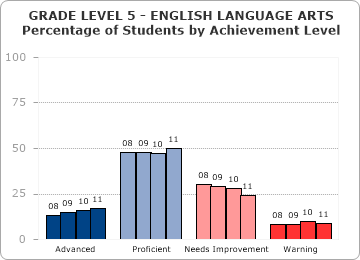
| GRADE LEVEL 5 - ENGLISH LANGUAGE ARTS |
|---|
| Student Group |
State |
| Students Included |
AYP Part. |
% at Each Level |
CPI |
SGP |
Incl. in SGP (#) |
| # |
% |
A |
P |
NI |
W |
| AYP Subgroups |
| Stud. w/ Disab | 13,752 | 99 | 2 |
25 |
41 |
32 |
66.1 | 43.0 |
11,703 |
| EL/Former EL | 7,342 | 99 | 4 |
31 |
40 |
25 |
66.8 | 47.0 |
6,351 |
| Low-Income | 25,750 | 99 | 5 |
40 |
38 |
17 |
75.1 | 45.0 |
23,370 |
| African American/Black | 5,675 | 99 | 6 |
40 |
38 |
16 |
75.5 | 48.0 |
5,083 |
| Asian | 3,953 | 100 | 27 |
48 |
18 |
7 |
89.1 | 57.0 |
3,675 |
| Hispanic/Latino | 10,841 | 99 | 5 |
36 |
38 |
21 |
71.9 | 45.0 |
9,652 |
| Native American | 146 | 100 | 13 |
43 |
34 |
10 |
81.3 | 49.0 |
137 |
| White | 48,929 | 100 | 20 |
54 |
20 |
5 |
90.1 | 51.0 |
46,722 |
| |
| Other Student Groups |
| High Needs | 33,912 | 99 | 5 |
39 |
38 |
18 |
75.1 | 46.0 |
30,521 |
| Male | 36,708 | 100 | 13 |
50 |
27 |
11 |
83.7 | 47.0 |
34,164 |
| Female | 34,658 | 100 | 22 |
50 |
22 |
7 |
88.4 | 52.0 |
32,794 |
| Title I | 24,491 | 99 | 6 |
41 |
37 |
16 |
75.9 | 46.0 |
22,425 |
| Non-Title I | 46,903 | 100 | 23 |
55 |
18 |
5 |
91.3 | 52.0 |
44,542 |
| Non-Low Income | 45,644 | 100 | 23 |
56 |
17 |
4 |
92.2 | 52.0 |
43,597 |
| EL | 5,018 | 98 | 1 |
22 |
44 |
32 |
59.3 | 45.0 |
4,153 |
| Former EL | 2,324 | 100 | 9 |
50 |
30 |
10 |
83.0 | 51.0 |
2,198 |
| 1st Yr EL* | 471 | 93 | - |
- |
- |
- |
- | N/A |
N/A |
| Native Hawaiian/ Pacific Islander | 94 | 99 | 17 |
53 |
20 |
10 |
88.3 | 50.0 |
86 |
| Multi-race - Non-Hispanic/Latino | 1,728 | 100 | 19 |
49 |
23 |
9 |
86.2 | 51.0 |
1,603 |
| |
| All Students |
| 2011 | 71,394 | 100 | 17 |
50 |
24 |
9 |
86.0 | 50.0 |
66,967 |
| 2010 | 71,007 | 100 | 16 |
47 |
28 |
10 |
84.2 | 50.0 |
66,744 |
 |
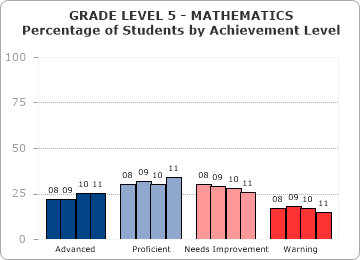
| GRADE LEVEL 5 - MATHEMATICS |
|---|
| Student Group |
State |
| Students Included |
AYP Part. |
% at Each Level |
CPI |
SGP |
Incl. in SGP (#) |
| # |
% |
A |
P |
NI |
W |
| AYP Subgroups |
| Stud. w/ Disab | 13,774 | 99 | 5 |
17 |
32 |
46 |
57.8 | 42.0 |
11,746 |
| EL/Former EL | 7,370 | 99 | 10 |
26 |
31 |
33 |
63.4 | 50.0 |
6,336 |
| Low-Income | 25,792 | 100 | 9 |
28 |
34 |
28 |
66.9 | 43.0 |
23,370 |
| African American/Black | 5,683 | 100 | 8 |
27 |
35 |
30 |
64.9 | 46.0 |
5,072 |
| Asian | 3,957 | 100 | 47 |
30 |
15 |
8 |
89.2 | 64.0 |
3,674 |
| Hispanic/Latino | 10,857 | 100 | 8 |
27 |
33 |
32 |
64.2 | 43.0 |
9,622 |
| Native American | 146 | 99 | 18 |
32 |
34 |
16 |
74.8 | 51.5 |
138 |
| White | 48,969 | 100 | 28 |
38 |
23 |
11 |
84.3 | 51.0 |
46,777 |
| |
| Other Student Groups |
| High Needs | 33,970 | 100 | 10 |
27 |
34 |
29 |
67.0 | 44.0 |
30,541 |
| Male | 36,756 | 100 | 25 |
33 |
25 |
17 |
79.3 | 50.0 |
34,227 |
| Female | 34,682 | 100 | 24 |
36 |
26 |
14 |
80.4 | 50.0 |
32,752 |
| Title I | 24,538 | 100 | 11 |
29 |
34 |
26 |
68.0 | 45.0 |
22,406 |
| Non-Title I | 46,925 | 100 | 32 |
37 |
21 |
10 |
86.0 | 52.0 |
44,580 |
| Non-Low Income | 45,671 | 100 | 33 |
38 |
21 |
8 |
87.1 | 53.0 |
43,616 |
| EL | 5,050 | 99 | 6 |
20 |
33 |
41 |
56.4 | 50.0 |
4,135 |
| Former EL | 2,320 | 100 | 19 |
38 |
27 |
17 |
78.5 | 51.0 |
2,201 |
| 1st Yr EL* | 543 | 98 | - |
- |
- |
- |
- | N/A |
N/A |
| Native Hawaiian/ Pacific Islander | 96 | 100 | 24 |
38 |
24 |
15 |
84.1 | 43.0 |
87 |
| Multi-race - Non-Hispanic/Latino | 1,730 | 100 | 27 |
31 |
27 |
15 |
79.5 | 50.0 |
1,609 |
| |
| All Students |
| 2011 | 71,463 | 100 | 25 |
34 |
26 |
15 |
79.8 | 50.0 |
66,986 |
| 2010 | 70,946 | 100 | 25 |
30 |
28 |
17 |
77.4 | 50.0 |
66,855 |
 |
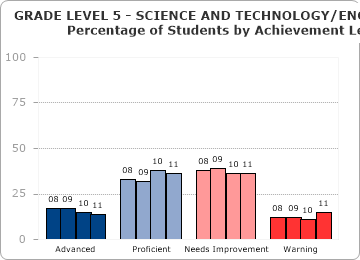
| GRADE LEVEL 5 - SCIENCE AND TECHNOLOGY/ENGINEERING |
|---|
| Student Group |
State |
| Students Included |
AYP Part. |
% at Each Level |
CPI |
SGP |
Incl. in SGP (#) |
| # |
% |
A |
P |
NI |
W |
| AYP Subgroups |
| Stud. w/ Disab | 13,736 | 99 | 4 |
17 |
41 |
39 |
60.3 | N/A |
N/A |
| EL/Former EL | 7,366 | 99 | 2 |
14 |
42 |
42 |
52.6 | N/A |
N/A |
| Low-Income | 25,758 | 100 | 4 |
22 |
45 |
29 |
62.0 | N/A |
N/A |
| African American/Black | 5,676 | 99 | 2 |
17 |
45 |
35 |
57.2 | N/A |
N/A |
| Asian | 3,957 | 100 | 22 |
36 |
29 |
12 |
80.7 | N/A |
N/A |
| Hispanic/Latino | 10,844 | 99 | 3 |
18 |
44 |
34 |
58.1 | N/A |
N/A |
| Native American | 145 | 99 | 8 |
30 |
43 |
19 |
71.0 | N/A |
N/A |
| White | 48,912 | 100 | 17 |
42 |
33 |
8 |
83.2 | N/A |
N/A |
| |
| Other Student Groups |
| High Needs | 33,917 | 99 | 4 |
23 |
45 |
28 |
63.6 | N/A |
N/A |
| Male | 36,711 | 100 | 15 |
36 |
33 |
15 |
78.2 | N/A |
N/A |
| Female | 34,647 | 100 | 12 |
35 |
38 |
15 |
75.8 | N/A |
N/A |
| Title I | 24,512 | 100 | 4 |
22 |
45 |
29 |
62.2 | N/A |
N/A |
| Non-Title I | 46,870 | 100 | 19 |
43 |
31 |
7 |
84.7 | N/A |
N/A |
| Non-Low Income | 45,624 | 100 | 20 |
44 |
30 |
7 |
85.5 | N/A |
N/A |
| EL | 5,046 | 99 | 1 |
9 |
39 |
52 |
45.5 | N/A |
N/A |
| Former EL | 2,320 | 100 | 6 |
25 |
49 |
20 |
67.8 | N/A |
N/A |
| 1st Yr EL* | 540 | 98 | - |
- |
- |
- |
- | N/A |
N/A |
| Native Hawaiian/ Pacific Islander | 96 | 100 | 11 |
39 |
34 |
16 |
77.6 | N/A |
N/A |
| Multi-race - Non-Hispanic/Latino | 1,728 | 100 | 15 |
35 |
37 |
13 |
77.8 | N/A |
N/A |
| |
| All Students |
| 2011 | 71,382 | 100 | 14 |
36 |
36 |
15 |
77.0 | N/A |
N/A |
| 2010 | 70,931 | 100 | 15 |
38 |
36 |
11 |
79.7 | N/A |
N/A |
 |
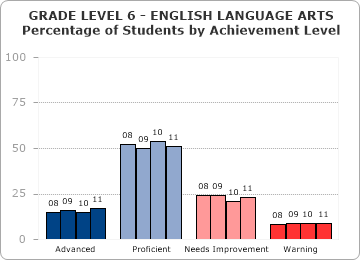
| GRADE LEVEL 6 - ENGLISH LANGUAGE ARTS |
|---|
| Student Group |
State |
| Students Included |
AYP Part. |
% at Each Level |
CPI |
SGP |
Incl. in SGP (#) |
| # |
% |
A |
P |
NI |
W |
| AYP Subgroups |
| Stud. w/ Disab | 13,567 | 99 | 2 |
26 |
40 |
32 |
66.0 | 44.0 |
11,630 |
| EL/Former EL | 6,070 | 99 | 3 |
28 |
39 |
29 |
64.1 | 49.0 |
5,160 |
| Low-Income | 25,709 | 99 | 5 |
42 |
36 |
17 |
75.4 | 45.0 |
23,245 |
| African American/Black | 5,863 | 99 | 5 |
40 |
38 |
17 |
74.7 | 44.0 |
5,187 |
| Asian | 3,585 | 100 | 28 |
49 |
17 |
6 |
90.3 | 59.0 |
3,324 |
| Hispanic/Latino | 10,626 | 99 | 5 |
37 |
37 |
21 |
71.7 | 45.0 |
9,461 |
| Native American | 174 | 100 | 10 |
50 |
30 |
10 |
82.9 | 50.0 |
164 |
| White | 49,572 | 100 | 21 |
56 |
18 |
5 |
90.9 | 51.0 |
47,240 |
| |
| Other Student Groups |
| High Needs | 33,533 | 99 | 5 |
41 |
36 |
18 |
75.4 | 46.0 |
30,155 |
| Male | 36,643 | 100 | 13 |
51 |
25 |
11 |
84.5 | 49.0 |
34,021 |
| Female | 34,821 | 100 | 22 |
51 |
20 |
7 |
88.7 | 51.0 |
32,881 |
| Title I | 21,947 | 99 | 6 |
42 |
36 |
16 |
75.9 | 45.0 |
19,932 |
| Non-Title I | 49,544 | 100 | 22 |
56 |
17 |
5 |
91.3 | 52.0 |
46,977 |
| Non-Low Income | 45,782 | 100 | 24 |
57 |
15 |
4 |
92.8 | 53.0 |
43,664 |
| EL | 3,860 | 99 | 1 |
19 |
42 |
38 |
56.0 | 48.0 |
3,062 |
| Former EL | 2,210 | 100 | 6 |
45 |
35 |
13 |
78.3 | 51.0 |
2,098 |
| 1st Yr EL* | 529 | 96 | - |
- |
- |
- |
- | N/A |
N/A |
| Native Hawaiian/ Pacific Islander | 62 | 100 | 11 |
40 |
37 |
11 |
81.9 | 52.5 |
54 |
| Multi-race - Non-Hispanic/Latino | 1,582 | 100 | 19 |
48 |
24 |
9 |
86.1 | 52.0 |
1,472 |
| |
| All Students |
| 2011 | 71,491 | 100 | 17 |
51 |
23 |
9 |
86.6 | 50.0 |
66,909 |
| 2010 | 72,172 | 100 | 15 |
54 |
21 |
9 |
86.8 | 50.0 |
67,589 |
 |
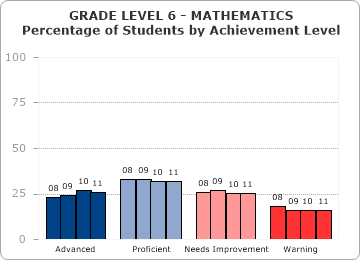
| GRADE LEVEL 6 - MATHEMATICS |
|---|
| Student Group |
State |
| Students Included |
AYP Part. |
% at Each Level |
CPI |
SGP |
Incl. in SGP (#) |
| # |
% |
A |
P |
NI |
W |
| AYP Subgroups |
| Stud. w/ Disab | 13,575 | 99 | 4 |
15 |
31 |
50 |
55.2 | 41.0 |
11,527 |
| EL/Former EL | 6,120 | 100 | 8 |
20 |
31 |
40 |
58.3 | 50.0 |
5,149 |
| Low-Income | 25,721 | 100 | 11 |
26 |
33 |
30 |
66.4 | 46.0 |
23,143 |
| African American/Black | 5,888 | 100 | 10 |
24 |
32 |
34 |
63.6 | 45.0 |
5,171 |
| Asian | 3,600 | 100 | 49 |
27 |
16 |
8 |
88.8 | 64.0 |
3,327 |
| Hispanic/Latino | 10,648 | 99 | 9 |
24 |
33 |
34 |
62.8 | 45.0 |
9,409 |
| Native American | 174 | 100 | 16 |
30 |
33 |
21 |
72.3 | 44.0 |
162 |
| White | 49,563 | 100 | 30 |
36 |
23 |
11 |
84.6 | 51.0 |
47,172 |
| |
| Other Student Groups |
| High Needs | 33,570 | 99 | 11 |
25 |
33 |
31 |
65.9 | 46.0 |
30,009 |
| Male | 36,652 | 100 | 26 |
31 |
25 |
18 |
79.0 | 49.0 |
33,945 |
| Female | 34,854 | 100 | 26 |
33 |
25 |
15 |
80.4 | 51.0 |
32,808 |
| Title I | 21,986 | 100 | 13 |
26 |
33 |
28 |
67.4 | 48.0 |
19,870 |
| Non-Title I | 49,550 | 100 | 32 |
35 |
21 |
11 |
85.1 | 51.0 |
46,890 |
| Non-Low Income | 45,815 | 100 | 35 |
36 |
21 |
9 |
87.1 | 52.0 |
43,617 |
| EL | 3,912 | 99 | 5 |
15 |
30 |
50 |
50.8 | 50.0 |
3,063 |
| Former EL | 2,208 | 100 | 15 |
29 |
33 |
23 |
71.5 | 50.0 |
2,086 |
| 1st Yr EL* | 591 | 99 | - |
- |
- |
- |
- | N/A |
N/A |
| Native Hawaiian/ Pacific Islander | 62 | 100 | 24 |
23 |
31 |
23 |
73.8 | 63.5 |
54 |
| Multi-race - Non-Hispanic/Latino | 1,571 | 99 | 27 |
30 |
25 |
18 |
78.4 | 53.0 |
1,458 |
| |
| All Students |
| 2011 | 71,536 | 100 | 26 |
32 |
25 |
16 |
79.6 | 50.0 |
66,760 |
| 2010 | 72,177 | 100 | 27 |
32 |
25 |
16 |
79.7 | 50.0 |
67,652 |
 |
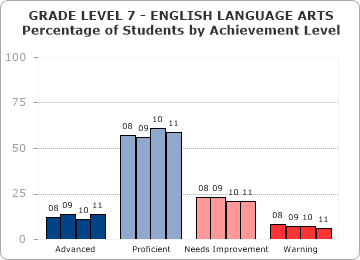
| GRADE LEVEL 7 - ENGLISH LANGUAGE ARTS |
|---|
| Student Group |
State |
| Students Included |
AYP Part. |
% at Each Level |
CPI |
SGP |
Incl. in SGP (#) |
| # |
% |
A |
P |
NI |
W |
| AYP Subgroups |
| Stud. w/ Disab | 13,682 | 98 | 1 |
30 |
44 |
25 |
70.8 | 42.0 |
11,761 |
| EL/Former EL | 4,801 | 98 | 2 |
33 |
42 |
23 |
69.1 | 54.0 |
3,985 |
| Low-Income | 25,276 | 99 | 4 |
49 |
34 |
12 |
80.6 | 47.0 |
22,818 |
| African American/Black | 5,892 | 99 | 5 |
51 |
33 |
11 |
81.6 | 52.0 |
5,201 |
| Asian | 3,631 | 99 | 28 |
54 |
15 |
4 |
93.0 | 60.0 |
3,370 |
| Hispanic/Latino | 10,431 | 98 | 4 |
46 |
36 |
14 |
78.2 | 48.0 |
9,239 |
| Native American | 175 | 100 | 5 |
58 |
31 |
6 |
85.6 | 48.0 |
163 |
| White | 50,554 | 99 | 17 |
63 |
16 |
4 |
92.6 | 50.0 |
48,163 |
| |
| Other Student Groups |
| High Needs | 32,954 | 99 | 4 |
48 |
35 |
13 |
80.2 | 47.0 |
29,569 |
| Male | 36,995 | 99 | 9 |
57 |
26 |
8 |
86.4 | 43.0 |
34,367 |
| Female | 35,235 | 99 | 20 |
61 |
15 |
4 |
92.9 | 57.0 |
33,224 |
| Title I | 19,614 | 99 | 5 |
51 |
34 |
11 |
81.4 | 48.0 |
17,776 |
| Non-Title I | 52,646 | 99 | 18 |
62 |
15 |
4 |
92.6 | 51.0 |
49,825 |
| Non-Low Income | 46,984 | 99 | 20 |
64 |
13 |
3 |
94.3 | 52.0 |
44,783 |
| EL | 3,207 | 97 | 1 |
22 |
47 |
30 |
61.7 | 52.0 |
2,475 |
| Former EL | 1,594 | 99 | 4 |
55 |
32 |
8 |
84.1 | 57.0 |
1,510 |
| 1st Yr EL* | 611 | 95 | - |
- |
- |
- |
- | N/A |
N/A |
| Native Hawaiian/ Pacific Islander | 60 | 98 | 17 |
62 |
15 |
7 |
92.5 | 55.0 |
56 |
| Multi-race - Non-Hispanic/Latino | 1,487 | 99 | 16 |
56 |
23 |
6 |
88.7 | 47.0 |
1,399 |
| |
| All Students |
| 2011 | 72,260 | 99 | 14 |
59 |
21 |
6 |
89.5 | 50.0 |
67,601 |
| 2010 | 71,350 | 99 | 11 |
61 |
21 |
7 |
88.6 | 50.0 |
66,670 |
 |
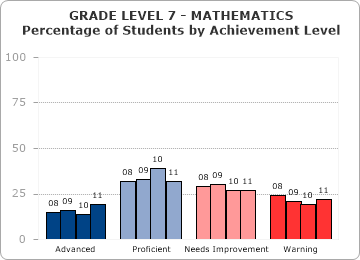
| GRADE LEVEL 7 - MATHEMATICS |
|---|
| Student Group |
State |
| Students Included |
AYP Part. |
% at Each Level |
CPI |
SGP |
Incl. in SGP (#) |
| # |
% |
A |
P |
NI |
W |
| AYP Subgroups |
| Stud. w/ Disab | 13,759 | 99 | 3 |
11 |
27 |
60 |
47.9 | 43.0 |
11,776 |
| EL/Former EL | 4,891 | 99 | 6 |
16 |
28 |
51 |
50.5 | 55.0 |
4,016 |
| Low-Income | 25,435 | 99 | 7 |
22 |
33 |
39 |
58.8 | 46.0 |
22,864 |
| African American/Black | 5,925 | 99 | 6 |
22 |
32 |
41 |
57.7 | 48.0 |
5,207 |
| Asian | 3,659 | 100 | 44 |
30 |
16 |
10 |
87.4 | 62.0 |
3,373 |
| Hispanic/Latino | 10,508 | 99 | 6 |
20 |
31 |
43 |
55.9 | 48.0 |
9,274 |
| Native American | 174 | 100 | 9 |
27 |
34 |
30 |
63.9 | 46.0 |
162 |
| White | 50,644 | 100 | 22 |
35 |
27 |
16 |
78.6 | 50.0 |
48,195 |
| |
| Other Student Groups |
| High Needs | 33,158 | 99 | 6 |
21 |
33 |
40 |
58.1 | 47.0 |
29,637 |
| Male | 37,156 | 99 | 19 |
30 |
27 |
24 |
72.6 | 47.0 |
34,457 |
| Female | 35,310 | 100 | 20 |
33 |
27 |
20 |
75.2 | 53.0 |
33,217 |
| Title I | 19,722 | 99 | 7 |
23 |
33 |
37 |
59.9 | 49.0 |
17,811 |
| Non-Title I | 52,773 | 100 | 24 |
35 |
25 |
16 |
79.0 | 51.0 |
49,874 |
| Non-Low Income | 47,060 | 100 | 26 |
37 |
25 |
13 |
82.0 | 52.0 |
44,821 |
| EL | 3,289 | 99 | 3 |
11 |
25 |
61 |
43.8 | 54.0 |
2,497 |
| Former EL | 1,602 | 100 | 10 |
26 |
33 |
31 |
64.2 | 56.0 |
1,519 |
| 1st Yr EL* | 680 | 100 | - |
- |
- |
- |
- | N/A |
N/A |
| Native Hawaiian/ Pacific Islander | 61 | 100 | 20 |
41 |
18 |
21 |
79.5 | 63.0 |
57 |
| Multi-race - Non-Hispanic/Latino | 1,495 | 100 | 19 |
29 |
27 |
25 |
71.1 | 48.0 |
1,406 |
| |
| All Students |
| 2011 | 72,495 | 99 | 19 |
32 |
27 |
22 |
73.8 | 50.0 |
67,685 |
| 2010 | 71,452 | 99 | 14 |
39 |
27 |
19 |
76.1 | 50.0 |
66,751 |
 |
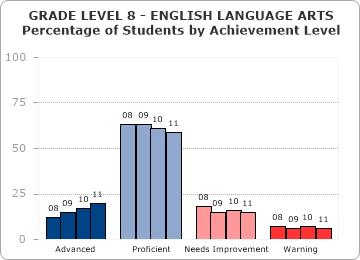
| GRADE LEVEL 8 - ENGLISH LANGUAGE ARTS |
|---|
| Student Group |
State |
| Students Included |
AYP Part. |
% at Each Level |
CPI |
SGP |
Incl. in SGP (#) |
| # |
% |
A |
P |
NI |
W |
| AYP Subgroups |
| Stud. w/ Disab | 13,173 | 98 | 2 |
39 |
34 |
25 |
73.5 | 45.0 |
11,329 |
| EL/Former EL | 4,166 | 98 | 2 |
34 |
35 |
28 |
67.0 | 55.0 |
3,289 |
| Low-Income | 24,487 | 99 | 7 |
55 |
25 |
12 |
82.9 | 49.0 |
22,181 |
| African American/Black | 5,812 | 99 | 7 |
58 |
25 |
11 |
84.0 | 50.0 |
5,235 |
| Asian | 3,681 | 99 | 34 |
51 |
11 |
4 |
93.8 | 60.0 |
3,395 |
| Hispanic/Latino | 9,967 | 98 | 6 |
52 |
27 |
15 |
80.0 | 50.0 |
8,834 |
| Native American | 205 | 100 | 13 |
60 |
19 |
9 |
87.7 | 48.0 |
190 |
| White | 50,465 | 99 | 23 |
61 |
11 |
4 |
93.9 | 50.0 |
48,333 |
| |
| Other Student Groups |
| High Needs | 31,988 | 99 | 6 |
54 |
26 |
14 |
82.4 | 49.0 |
28,713 |
| Male | 36,712 | 99 | 14 |
60 |
18 |
8 |
88.6 | 46.0 |
34,285 |
| Female | 34,950 | 99 | 27 |
58 |
11 |
4 |
93.8 | 55.0 |
33,139 |
| Title I | 18,648 | 99 | 8 |
57 |
25 |
11 |
83.8 | 50.0 |
17,056 |
| Non-Title I | 53,035 | 99 | 25 |
60 |
11 |
5 |
93.6 | 50.0 |
50,379 |
| Non-Low Income | 47,196 | 99 | 27 |
61 |
9 |
3 |
95.3 | 51.0 |
45,254 |
| EL | 2,958 | 97 | 1 |
24 |
40 |
35 |
59.6 | 53.0 |
2,157 |
| Former EL | 1,208 | 100 | 7 |
59 |
23 |
10 |
85.1 | 58.0 |
1,132 |
| 1st Yr EL* | 546 | 94 | - |
- |
- |
- |
- | N/A |
N/A |
| Native Hawaiian/ Pacific Islander | 78 | 99 | 19 |
59 |
14 |
8 |
89.7 | 55.0 |
67 |
| Multi-race - Non-Hispanic/Latino | 1,454 | 99 | 21 |
59 |
14 |
6 |
91.6 | 52.0 |
1,370 |
| |
| All Students |
| 2011 | 71,683 | 99 | 20 |
59 |
15 |
6 |
91.1 | 50.0 |
67,435 |
| 2010 | 72,237 | 99 | 17 |
61 |
16 |
7 |
90.4 | 50.0 |
67,821 |
 |
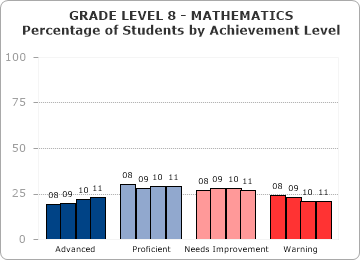
| GRADE LEVEL 8 - MATHEMATICS |
|---|
| Student Group |
State |
| Students Included |
AYP Part. |
% at Each Level |
CPI |
SGP |
Incl. in SGP (#) |
| # |
% |
A |
P |
NI |
W |
| AYP Subgroups |
| Stud. w/ Disab | 13,168 | 98 | 3 |
11 |
26 |
60 |
48.1 | 46.0 |
11,283 |
| EL/Former EL | 4,205 | 99 | 7 |
14 |
25 |
54 |
48.6 | 58.0 |
3,296 |
| Low-Income | 24,486 | 99 | 9 |
21 |
32 |
38 |
59.4 | 48.0 |
22,182 |
| African American/Black | 5,822 | 99 | 7 |
21 |
32 |
39 |
57.7 | 49.0 |
5,220 |
| Asian | 3,698 | 100 | 48 |
26 |
16 |
10 |
87.0 | 61.0 |
3,400 |
| Hispanic/Latino | 9,967 | 99 | 8 |
19 |
30 |
43 |
55.8 | 50.0 |
8,855 |
| Native American | 204 | 99 | 12 |
27 |
33 |
27 |
66.1 | 46.0 |
190 |
| White | 50,486 | 99 | 27 |
32 |
26 |
16 |
78.9 | 50.0 |
48,340 |
| |
| Other Student Groups |
| High Needs | 32,009 | 99 | 8 |
20 |
31 |
40 |
58.5 | 48.0 |
28,700 |
| Male | 36,733 | 99 | 23 |
28 |
26 |
22 |
73.9 | 51.0 |
34,274 |
| Female | 34,980 | 99 | 23 |
29 |
27 |
20 |
74.6 | 50.0 |
33,169 |
| Title I | 18,653 | 99 | 11 |
22 |
31 |
36 |
60.8 | 50.0 |
17,059 |
| Non-Title I | 53,087 | 99 | 28 |
31 |
25 |
16 |
79.0 | 50.0 |
50,397 |
| Non-Low Income | 47,254 | 99 | 31 |
33 |
24 |
13 |
81.9 | 51.0 |
45,274 |
| EL | 2,998 | 99 | 4 |
10 |
23 |
63 |
42.3 | 57.0 |
2,172 |
| Former EL | 1,207 | 99 | 13 |
24 |
31 |
32 |
64.3 | 60.5 |
1,124 |
| 1st Yr EL* | 592 | 100 | - |
- |
- |
- |
- | N/A |
N/A |
| Native Hawaiian/ Pacific Islander | 80 | 100 | 19 |
28 |
28 |
26 |
70.3 | 57.0 |
68 |
| Multi-race - Non-Hispanic/Latino | 1,456 | 99 | 24 |
28 |
26 |
22 |
73.7 | 50.0 |
1,370 |
| |
| All Students |
| 2011 | 71,740 | 99 | 23 |
29 |
27 |
21 |
74.2 | 50.0 |
67,456 |
| 2010 | 72,180 | 99 | 22 |
29 |
28 |
21 |
74.8 | 51.0 |
67,938 |
 |
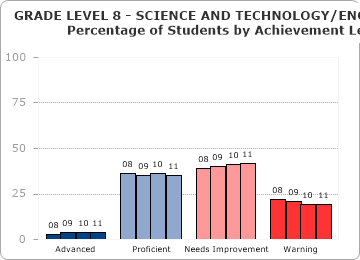
| GRADE LEVEL 8 - SCIENCE AND TECHNOLOGY/ENGINEERING |
|---|
| Student Group |
State |
| Students Included |
AYP Part. |
% at Each Level |
CPI |
SGP |
Incl. in SGP (#) |
| # |
% |
A |
P |
NI |
W |
| AYP Subgroups |
| Stud. w/ Disab | 13,096 | 98 | 1 |
11 |
41 |
48 |
50.9 | N/A |
N/A |
| EL/Former EL | 4,196 | 99 | 0 |
7 |
31 |
62 |
39.8 | N/A |
N/A |
| Low-Income | 24,392 | 99 | 1 |
16 |
46 |
37 |
53.9 | N/A |
N/A |
| African American/Black | 5,799 | 99 | 1 |
13 |
46 |
41 |
50.7 | N/A |
N/A |
| Asian | 3,696 | 100 | 10 |
41 |
34 |
14 |
76.9 | N/A |
N/A |
| Hispanic/Latino | 9,925 | 98 | 1 |
12 |
42 |
45 |
49.0 | N/A |
N/A |
| Native American | 203 | 99 | 0 |
24 |
49 |
26 |
62.2 | N/A |
N/A |
| White | 50,390 | 99 | 5 |
41 |
43 |
11 |
76.3 | N/A |
N/A |
| |
| Other Student Groups |
| High Needs | 31,899 | 98 | 1 |
16 |
47 |
36 |
54.9 | N/A |
N/A |
| Male | 36,644 | 99 | 5 |
36 |
41 |
18 |
71.6 | N/A |
N/A |
| Female | 34,899 | 99 | 4 |
33 |
44 |
19 |
69.0 | N/A |
N/A |
| Title I | 18,581 | 99 | 1 |
17 |
45 |
37 |
54.0 | N/A |
N/A |
| Non-Title I | 52,988 | 99 | 6 |
41 |
41 |
12 |
76.0 | N/A |
N/A |
| Non-Low Income | 47,177 | 99 | 6 |
44 |
40 |
9 |
78.8 | N/A |
N/A |
| EL | 2,992 | 99 | 0 |
3 |
25 |
72 |
34.8 | N/A |
N/A |
| Former EL | 1,204 | 99 | 1 |
16 |
44 |
40 |
52.3 | N/A |
N/A |
| 1st Yr EL* | 589 | 99 | - |
- |
- |
- |
- | N/A |
N/A |
| Native Hawaiian/ Pacific Islander | 80 | 100 | 1 |
36 |
46 |
16 |
69.4 | N/A |
N/A |
| Multi-race - Non-Hispanic/Latino | 1,450 | 99 | 4 |
35 |
42 |
18 |
70.2 | N/A |
N/A |
| |
| All Students |
| 2011 | 71,569 | 99 | 4 |
35 |
42 |
19 |
70.3 | N/A |
N/A |
| 2010 | 72,026 | 99 | 4 |
36 |
41 |
19 |
71.0 | N/A |
N/A |
 |
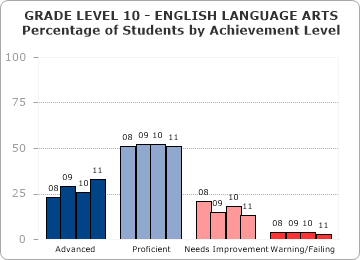
| GRADE LEVEL 10 - ENGLISH LANGUAGE ARTS |
|---|
| Student Group |
State |
| Students Included |
AYP Part. |
% at Each Level |
CPI |
SGP |
Incl. in SGP (#) |
| # |
% |
A |
P |
NI |
F |
| AYP Subgroups |
| Stud. w/ Disab | 11,594 | 95 | 5 |
44 |
35 |
15 |
80.2 | 43.0 |
9,421 |
| EL/Former EL | 3,517 | 96 | 3 |
34 |
44 |
18 |
69.7 | 56.0 |
1,828 |
| Low-Income | 21,826 | 97 | 14 |
55 |
24 |
7 |
87.4 | 46.0 |
17,588 |
| African American/Black | 5,956 | 97 | 14 |
55 |
24 |
6 |
87.6 | 50.0 |
4,561 |
| Asian | 3,629 | 99 | 45 |
42 |
11 |
2 |
94.6 | 57.0 |
3,073 |
| Hispanic/Latino | 8,894 | 96 | 12 |
52 |
27 |
9 |
84.5 | 45.0 |
6,776 |
| Native American | 181 | 98 | 15 |
56 |
25 |
4 |
89.4 | 45.0 |
151 |
| White | 49,447 | 99 | 38 |
51 |
9 |
2 |
96.3 | 50.0 |
44,902 |
| |
| Other Student Groups |
| High Needs | 29,011 | 97 | 13 |
55 |
25 |
8 |
86.9 | 46.0 |
23,502 |
| Male | 35,146 | 98 | 27 |
54 |
15 |
4 |
92.6 | 51.0 |
30,359 |
| Female | 34,378 | 98 | 39 |
48 |
10 |
2 |
95.3 | 49.0 |
30,324 |
| Title I | 12,556 | 97 | 11 |
57 |
26 |
6 |
87.0 | 45.0 |
9,900 |
| Non-Title I | 56,976 | 98 | 38 |
50 |
9 |
3 |
95.4 | 51.0 |
50,797 |
| Non-Low Income | 47,706 | 99 | 42 |
49 |
7 |
2 |
96.9 | 52.0 |
43,109 |
| EL | 2,558 | 95 | 2 |
26 |
49 |
24 |
63.4 | 52.5 |
1,046 |
| Former EL | 959 | 98 | 8 |
57 |
30 |
5 |
86.6 | 59.0 |
782 |
| 1st Yr EL* | 432 | 92 | - |
- |
- |
- |
- | N/A |
N/A |
| Native Hawaiian/ Pacific Islander | 84 | 98 | 31 |
54 |
7 |
8 |
91.7 | 55.0 |
61 |
| Multi-race - Non-Hispanic/Latino | 1,333 | 98 | 34 |
52 |
12 |
2 |
94.8 | 49.0 |
1,159 |
| |
| All Students |
| 2011 | 69,532 | 98 | 33 |
51 |
13 |
3 |
93.9 | 50.0 |
60,697 |
| 2010 | 70,369 | 98 | 26 |
52 |
18 |
4 |
91.9 | 50.0 |
60,626 |
 |
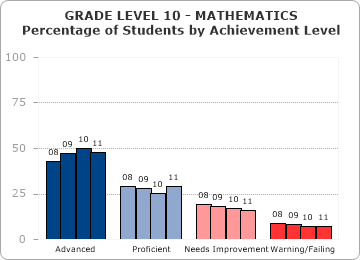
| GRADE LEVEL 10 - MATHEMATICS |
|---|
| Student Group |
State |
| Students Included |
AYP Part. |
% at Each Level |
CPI |
SGP |
Incl. in SGP (#) |
| # |
% |
A |
P |
NI |
F |
| AYP Subgroups |
| Stud. w/ Disab | 11,592 | 95 | 12 |
27 |
34 |
27 |
70.1 | 46.0 |
9,390 |
| EL/Former EL | 3,540 | 97 | 19 |
22 |
31 |
29 |
66.2 | 59.0 |
1,840 |
| Low-Income | 21,722 | 97 | 27 |
31 |
27 |
14 |
79.7 | 48.0 |
17,545 |
| African American/Black | 5,930 | 97 | 24 |
32 |
29 |
15 |
78.3 | 52.0 |
4,571 |
| Asian | 3,636 | 99 | 71 |
17 |
9 |
3 |
94.6 | 65.0 |
3,067 |
| Hispanic/Latino | 8,855 | 97 | 23 |
29 |
30 |
18 |
75.5 | 48.0 |
6,750 |
| Native American | 181 | 96 | 28 |
37 |
24 |
12 |
81.8 | 46.0 |
151 |
| White | 49,320 | 99 | 54 |
29 |
13 |
4 |
92.9 | 50.0 |
44,827 |
| |
| Other Student Groups |
| High Needs | 28,888 | 97 | 25 |
31 |
28 |
15 |
79.1 | 48.0 |
23,423 |
| Male | 35,051 | 98 | 48 |
28 |
16 |
8 |
88.7 | 52.0 |
30,319 |
| Female | 34,285 | 98 | 49 |
30 |
16 |
6 |
90.1 | 49.0 |
30,264 |
| Title I | 12,440 | 97 | 26 |
31 |
29 |
14 |
78.9 | 51.0 |
9,864 |
| Non-Title I | 56,902 | 98 | 53 |
28 |
13 |
5 |
91.7 | 50.0 |
50,735 |
| Non-Low Income | 47,620 | 99 | 58 |
27 |
11 |
4 |
93.8 | 51.0 |
43,054 |
| EL | 2,589 | 97 | 15 |
20 |
32 |
34 |
61.6 | 56.0 |
1,058 |
| Former EL | 951 | 98 | 30 |
27 |
29 |
14 |
78.9 | 61.0 |
782 |
| 1st Yr EL* | 456 | 99 | - |
- |
- |
- |
- | N/A |
N/A |
| Native Hawaiian/ Pacific Islander | 85 | 100 | 49 |
27 |
18 |
6 |
88.5 | 60.0 |
63 |
| Multi-race - Non-Hispanic/Latino | 1,329 | 97 | 47 |
30 |
18 |
6 |
89.3 | 47.0 |
1,154 |
| |
| All Students |
| 2011 | 69,342 | 98 | 48 |
29 |
16 |
7 |
89.4 | 50.0 |
60,599 |
| 2010 | 70,401 | 98 | 50 |
25 |
17 |
7 |
88.8 | 50.0 |
60,674 |
 |
| GRADE LEVEL 10 - SCIENCE AND TECHNOLOGY/ENGINEERING |
|---|
| Student Group |
State |
| Students Included |
AYP Part. |
% at Each Level |
CPI |
SGP |
Incl. in SGP (#) |
| # |
% |
A |
P |
NI |
F |
| AYP Subgroups |
| Stud. w/ Disab | 11,866 | 97 | 3 |
27 |
46 |
24 |
67.1 | N/A |
N/A |
| EL/Former EL | 3,062 | 97 | 3 |
20 |
47 |
30 |
59.3 | N/A |
N/A |
| Low-Income | 21,464 | 98 | 7 |
37 |
42 |
14 |
73.9 | N/A |
N/A |
| African American/Black | 5,780 | 98 | 6 |
34 |
45 |
16 |
71.5 | N/A |
N/A |
| Asian | 3,435 | 99 | 37 |
39 |
20 |
4 |
89.9 | N/A |
N/A |
| Hispanic/Latino | 8,654 | 98 | 5 |
31 |
46 |
19 |
68.6 | N/A |
N/A |
| Native American | 183 | 100 | 4 |
46 |
40 |
10 |
77.3 | N/A |
N/A |
| White | 49,041 | 99 | 23 |
51 |
22 |
4 |
90.2 | N/A |
N/A |
| |
| Other Student Groups |
| High Needs | 28,656 | 98 | 6 |
36 |
43 |
15 |
73.9 | N/A |
N/A |
| Male | 34,793 | 99 | 21 |
46 |
26 |
7 |
85.6 | N/A |
N/A |
| Female | 33,678 | 99 | 19 |
48 |
27 |
6 |
85.9 | N/A |
N/A |
| Title I | 12,359 | 98 | 5 |
33 |
46 |
16 |
70.9 | N/A |
N/A |
| Non-Title I | 56,112 | 99 | 23 |
49 |
23 |
5 |
89.0 | N/A |
N/A |
| Non-Low Income | 47,007 | 99 | 26 |
51 |
20 |
3 |
91.1 | N/A |
N/A |
| EL | 2,111 | 96 | 2 |
14 |
47 |
37 |
53.6 | N/A |
N/A |
| Former EL | 951 | 99 | 6 |
34 |
46 |
15 |
71.9 | N/A |
N/A |
| 1st Yr EL* | | - | - | - | - | - | - | - | - |
| Native Hawaiian/ Pacific Islander | 72 | 95 | 19 |
47 |
24 |
10 |
84.7 | N/A |
N/A |
| Multi-race - Non-Hispanic/Latino | 1,306 | 99 | 21 |
45 |
28 |
6 |
86.0 | N/A |
N/A |
| |
| All Students |
| 2011 | 68,471 | 99 | 20 |
47 |
27 |
7 |
85.7 | N/A |
N/A |
| 2010 | 68,240 | 98 | 18 |
47 |
28 |
8 |
84.6 | N/A |
N/A |
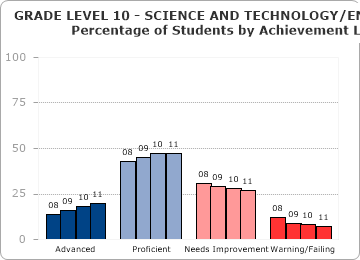 |
| * Note: Grade 10 Science and Technology/Engineering results represent the highest performance level attained by class of 2013 students in grades 9 or 10 in any of the four subjects (Biology, Chemistry, Introductory Physics, and Technology/Engineering). In addition, only students enrolled in Massachusetts since October 2009 are included in state-level results; only students enrolled in the same district since October 2009 are included in district-level results; only students enrolled in the same school since October 2009 are included in school-level results. |
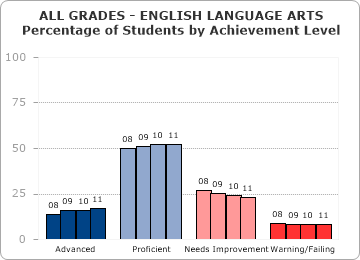
| ALL GRADES - ENGLISH LANGUAGE ARTS |
|---|
| Student Group |
State |
| Students Included |
AYP Part. |
% at Each Level |
CPI |
SGP |
Incl. in SGP (#) |
| # |
% |
A |
P |
NI |
W |
| AYP Subgroups |
| Stud. w/ Disab | 92,004 | 98 | 2 |
28 |
41 |
29 |
68.3 | 42.0 |
67,383 |
| EL/Former EL | 42,402 | 98 | 3 |
30 |
42 |
25 |
66.2 | 50.0 |
27,475 |
| Low-Income | 174,384 | 99 | 6 |
43 |
36 |
15 |
77.1 | 46.0 |
132,764 |
| African American/Black | 40,300 | 99 | 6 |
44 |
35 |
15 |
77.4 | 47.0 |
30,278 |
| Asian | 26,656 | 99 | 28 |
49 |
18 |
6 |
90.2 | 59.0 |
20,597 |
| Hispanic/Latino | 72,903 | 99 | 5 |
40 |
37 |
18 |
74.2 | 46.0 |
53,717 |
| Native American | 1,213 | 100 | 10 |
49 |
32 |
9 |
82.6 | 47.0 |
958 |
| White | 343,938 | 99 | 21 |
56 |
19 |
5 |
90.9 | 51.0 |
281,256 |
| |
| Other Student Groups |
| High Needs | 229,396 | 99 | 5 |
42 |
36 |
16 |
77.0 | 46.0 |
173,378 |
| Male | 254,409 | 99 | 13 |
51 |
26 |
10 |
84.7 | 47.0 |
201,101 |
| Female | 242,686 | 99 | 22 |
53 |
20 |
5 |
89.8 | 53.0 |
195,020 |
| Title I | 148,778 | 99 | 6 |
43 |
37 |
15 |
76.8 | 46.0 |
110,697 |
| Non-Title I | 348,480 | 99 | 22 |
56 |
17 |
5 |
91.6 | 52.0 |
285,485 |
| Non-Low Income | 322,874 | 99 | 24 |
57 |
16 |
4 |
92.6 | 52.0 |
263,418 |
| EL | 29,528 | 98 | 1 |
21 |
46 |
31 |
59.4 | 48.0 |
17,497 |
| Former EL | 12,874 | 99 | 7 |
49 |
33 |
10 |
81.7 | 54.0 |
9,978 |
| 1st Yr EL* | | - | - | - | - | - | - | - | - |
| Native Hawaiian/ Pacific Islander | 549 | 99 | 17 |
51 |
22 |
10 |
86.3 | 53.5 |
412 |
| Multi-race - Non-Hispanic/Latino | 11,536 | 99 | 18 |
51 |
24 |
8 |
86.9 | 51.0 |
8,903 |
| |
| All Students |
| 2011 | 497,258 | 99 | 17 |
52 |
23 |
8 |
87.2 | 50.0 |
396,182 |
| 2010 | 498,668 | 99 | 16 |
52 |
24 |
8 |
86.9 | 50.0 |
396,078 |
 |
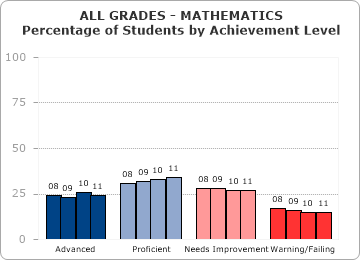
| ALL GRADES - MATHEMATICS |
|---|
| Student Group |
State |
| Students Included |
AYP Part. |
% at Each Level |
CPI |
SGP |
Incl. in SGP (#) |
| # |
% |
A |
P |
NI |
W |
| AYP Subgroups |
| Stud. w/ Disab | 92,185 | 99 | 5 |
17 |
33 |
45 |
57.7 | 43.0 |
67,337 |
| EL/Former EL | 42,747 | 99 | 9 |
24 |
34 |
34 |
62.0 | 52.0 |
27,467 |
| Low-Income | 174,589 | 99 | 10 |
27 |
35 |
27 |
67.3 | 46.0 |
132,625 |
| African American/Black | 40,391 | 99 | 9 |
25 |
36 |
30 |
65.0 | 47.0 |
30,273 |
| Asian | 26,741 | 100 | 45 |
32 |
16 |
7 |
89.5 | 64.0 |
20,599 |
| Hispanic/Latino | 73,062 | 99 | 9 |
25 |
35 |
30 |
64.4 | 46.0 |
53,604 |
| Native American | 1,206 | 99 | 14 |
31 |
35 |
20 |
72.7 | 47.0 |
956 |
| White | 344,050 | 99 | 28 |
37 |
25 |
10 |
84.3 | 50.0 |
281,305 |
| |
| Other Student Groups |
| High Needs | 229,782 | 99 | 10 |
27 |
35 |
28 |
67.1 | 46.0 |
173,254 |
| Male | 254,687 | 99 | 24 |
33 |
26 |
16 |
79.4 | 50.0 |
201,207 |
| Female | 242,853 | 99 | 24 |
35 |
27 |
13 |
80.5 | 51.0 |
194,843 |
| Title I | 148,969 | 99 | 10 |
28 |
36 |
25 |
68.2 | 48.0 |
110,579 |
| Non-Title I | 348,743 | 99 | 30 |
37 |
23 |
10 |
85.0 | 51.0 |
285,536 |
| Non-Low Income | 323,123 | 100 | 32 |
38 |
22 |
8 |
86.8 | 52.0 |
263,490 |
| EL | 29,878 | 99 | 6 |
20 |
35 |
40 |
56.3 | 52.0 |
17,513 |
| Former EL | 12,869 | 100 | 16 |
34 |
32 |
18 |
75.1 | 53.0 |
9,954 |
| 1st Yr EL* | | - | - | - | - | - | - | - | - |
| Native Hawaiian/ Pacific Islander | 555 | 100 | 23 |
33 |
28 |
16 |
79.5 | 54.0 |
419 |
| Multi-race - Non-Hispanic/Latino | 11,535 | 99 | 24 |
33 |
28 |
15 |
79.1 | 50.0 |
8,894 |
| |
| All Students |
| 2011 | 497,712 | 99 | 24 |
34 |
27 |
15 |
79.9 | 50.0 |
396,115 |
| 2010 | 498,632 | 99 | 26 |
33 |
27 |
15 |
79.9 | 50.0 |
396,662 |
 |
| ALL GRADES - SCIENCE AND TECHNOLOGY/ENGINEERING |
|---|
| Student Group |
State |
| Students Included |
AYP Part. |
% at Each Level |
CPI |
SGP |
Incl. in SGP (#) |
| # |
% |
A |
P |
NI |
W |
| AYP Subgroups |
| Stud. w/ Disab | | - | - | - | - | - | - | - | - |
| EL/Former EL | | - | - | - | - | - | - | - | - |
| Low-Income | | - | - | - | - | - | - | - | - |
| African American/Black | | - | - | - | - | - | - | - | - |
| Asian | | - | - | - | - | - | - | - | - |
| Hispanic/Latino | | - | - | - | - | - | - | - | - |
| Native American | | - | - | - | - | - | - | - | - |
| White | | - | - | - | - | - | - | - | - |
| |
| Other Student Groups |
| High Needs | | - | - | - | - | - | - | - | - |
| Male | | - | - | - | - | - | - | - | - |
| Female | | - | - | - | - | - | - | - | - |
| Title I | | - | - | - | - | - | - | - | - |
| Non-Title I | | - | - | - | - | - | - | - | - |
| Non-Low Income | | - | - | - | - | - | - | - | - |
| EL | | - | - | - | - | - | - | - | - |
| Former EL | | - | - | - | - | - | - | - | - |
| 1st Yr EL* | | - | - | - | - | - | - | - | - |
| Native Hawaiian/ Pacific Islander | | - | - | - | - | - | - | - | - |
| Multi-race - Non-Hispanic/Latino | | - | - | - | - | - | - | - | - |
| |
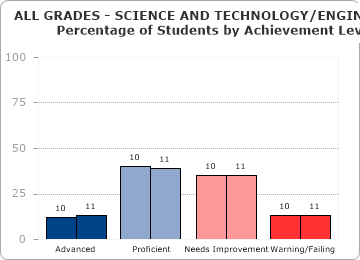
| All Students |
| 2011 | 211,422 | 100 | 13 |
39 |
35 |
13 |
77.6 | N/A |
N/A |
| 2010 | 211,135 | 100 | 12 |
40 |
35 |
13 |
78.3 | N/A |
N/A |
|


